KRAS
K-Ras4B, KRAS1, KRAS2
Gene Name: KRAS
Synonyms: K-Ras4B, KRAS1, KRAS2
Description: KRAS proto-oncogene, GTPase
Protein Class: Cancer-related genes, Disease related genes, Enzymes, FDA approved drug targets, Human disease related genes, Predicted intracellular proteins, RAS pathway related proteins
Ensembl ID: ENSG00000133703
UniProt ID: P01116
RNA Tissue Specific nTPM: Not available
RNA Single Cell Type Specific nTPM: Not available
RNA Tissue Cell Type Enrichment: Not available
RNA Cancer Specificity: Low cancer specificity
RNA Cancer Specific FPKM: Not available
NCBI Summary: This gene, a Kirsten ras oncogene homolog from the mammalian ras gene family, encodes a protein that is a member of the small GTPase superfamily. A single amino acid substitution is responsible for an activating mutation. The transforming protein that results is implicated in various malignancies, including lung adenocarcinoma, mucinous adenoma, ductal carcinoma of the pancreas and colorectal carcinoma. Alternative splicing leads to variants encoding two isoforms that differ in the C-terminal region. [provided by RefSeq, Jul 2008]
This protein has been detected in 1 cellular location:
Antibody reactivity data from protein arrays and peptide libraries.
Human proteome microarrays detect autoantibodies against 21,000 full-length proteins via fluorescent immunoassay (HuProt). Median foreground intensity (MFI) from duplicate spots are averaged and log2-transformed. Hits are called when Z-score ≥3 across the array and signal is >4-fold above secondary-only control MFI for that protein. Displayed are Z-scores for patients passing this threshold; non-hits shown as zero. All data are binarized into hit / no-hit for statistics for case vs cohort and case vs control analysis via Fisher exact test with BH correction. Complete data with antigen sequences available for download below. Learn more about our assay platforms.
| ID | Name | Total Hits | Control_Pooled (n=23) |
Vietnam_HCC (n=120) |
Vietnam_Cirrohosis (n=60) |
Vietnam_Hepatitis_B (n=60) |
|||||||||||||||||||||||||||||||||||||||||||||||||||||||||||||||||||||||||||||||||||||||||||||||||||||||||||||||||||||||||||||||||||||||||||||||||||||||||||||||||||||||||||||||||||||||||||||||||||||||||||||||||||||||||||||||||||||||||||||||||||||||||||||||||||
|---|---|---|---|---|---|---|---|---|---|---|---|---|---|---|---|---|---|---|---|---|---|---|---|---|---|---|---|---|---|---|---|---|---|---|---|---|---|---|---|---|---|---|---|---|---|---|---|---|---|---|---|---|---|---|---|---|---|---|---|---|---|---|---|---|---|---|---|---|---|---|---|---|---|---|---|---|---|---|---|---|---|---|---|---|---|---|---|---|---|---|---|---|---|---|---|---|---|---|---|---|---|---|---|---|---|---|---|---|---|---|---|---|---|---|---|---|---|---|---|---|---|---|---|---|---|---|---|---|---|---|---|---|---|---|---|---|---|---|---|---|---|---|---|---|---|---|---|---|---|---|---|---|---|---|---|---|---|---|---|---|---|---|---|---|---|---|---|---|---|---|---|---|---|---|---|---|---|---|---|---|---|---|---|---|---|---|---|---|---|---|---|---|---|---|---|---|---|---|---|---|---|---|---|---|---|---|---|---|---|---|---|---|---|---|---|---|---|---|---|---|---|---|---|---|---|---|---|---|---|---|---|---|---|---|---|---|---|---|---|---|---|---|---|---|---|---|---|---|---|---|---|---|---|---|---|---|---|---|---|---|---|---|---|---|---|
| JHU00236.B4C19R2 | KRAS|P01116-2 | 13/263 | |||||||||||||||||||||||||||||||||||||||||||||||||||||||||||||||||||||||||||||||||||||||||||||||||||||||||||||||||||||||||||||||||||||||||||||||||||||||||||||||||||||||||||||||||||||||||||||||||||||||||||||||||||||||||||||||||||||||||||||||||||||||||||||||||||||||
| JHU11656.B12C32R6 | KRAS|P01116 | 0/263 | |||||||||||||||||||||||||||||||||||||||||||||||||||||||||||||||||||||||||||||||||||||||||||||||||||||||||||||||||||||||||||||||||||||||||||||||||||||||||||||||||||||||||||||||||||||||||||||||||||||||||||||||||||||||||||||||||||||||||||||||||||||||||||||||||||||||
| JHU13939.B11C29R38 | KRAS|P01116-2 | 92/263 | |||||||||||||||||||||||||||||||||||||||||||||||||||||||||||||||||||||||||||||||||||||||||||||||||||||||||||||||||||||||||||||||||||||||||||||||||||||||||||||||||||||||||||||||||||||||||||||||||||||||||||||||||||||||||||||||||||||||||||||||||||||||||||||||||||||||
| ID | Name | Platform | Group | Comparison | P-value | BH Adjusted | Significant | Log OR | Hits Group |
Hits Comparison |
|---|---|---|---|---|---|---|---|---|---|---|
| JHU13939.B11C29R38 | KRAS|P01116-2 | HuProt_635 | Vietnam_Hepatitis_B | vs_control | 0.012 | 0.417 | No | 1.475 | 29/60 | 4/23 |
| JHU13939.B11C29R38 | KRAS|P01116-2 | HuProt_635 | Vietnam_Hepatitis_B | vs_cohort | 0.020 | 0.432 | No | 0.729 | 29/60 | 63/203 |
| JHU13939.B11C29R38 | KRAS|P01116-2 | HuProt_635 | Vietnam_HCC | vs_cohort | 0.153 | 0.775 | No | -0.405 | 36/120 | 56/143 |
| JHU13939.B11C29R38 | KRAS|P01116-2 | HuProt_635 | Vietnam_Cirrohosis | vs_control | 0.115 | 0.883 | No | 1.071 | 23/60 | 4/23 |
| JHU13939.B11C29R38 | KRAS|P01116-2 | HuProt_635 | Vietnam_HCC | vs_control | 0.311 | 0.893 | No | 0.706 | 36/120 | 4/23 |
| JHU00236.B4C19R2 | KRAS|P01116-2 | HuProt_635 | Vietnam_Hepatitis_B | vs_cohort | 0.501 | 1.000 | No | 0.430 | 4/60 | 9/203 |
| JHU13939.B11C29R38 | KRAS|P01116-2 | HuProt_635 | Vietnam_Cirrohosis | vs_cohort | 0.541 | 1.000 | No | 0.188 | 23/60 | 69/203 |
| JHU00236.B4C19R2 | KRAS|P01116-2 | HuProt_635 | Vietnam_HCC | vs_cohort | 0.777 | 1.000 | No | -0.309 | 5/120 | 8/143 |
| JHU00236.B4C19R2 | KRAS|P01116-2 | HuProt_635 | Vietnam_Cirrohosis | vs_cohort | 1.000 | 1.000 | No | 0.016 | 3/60 | 10/203 |
| JHU00236.B4C19R2 | KRAS|P01116-2 | HuProt_635 | Vietnam_Cirrohosis | vs_control | 1.000 | 1.000 | No | 0.145 | 3/60 | 1/23 |
| JHU00236.B4C19R2 | KRAS|P01116-2 | HuProt_635 | Vietnam_HCC | vs_control | 1.000 | 1.000 | No | -0.044 | 5/120 | 1/23 |
| JHU00236.B4C19R2 | KRAS|P01116-2 | HuProt_635 | Vietnam_Hepatitis_B | vs_control | 1.000 | 1.000 | No | 0.447 | 4/60 | 1/23 |
The same HuProt microarray assay as-described above; additionally stained with an anti-IgA secondary. Learn more about our assay platforms.
| ID | Name | Total Hits | Control_Pooled (n=23) |
Vietnam_HCC (n=120) |
Vietnam_Cirrohosis (n=60) |
Vietnam_Hepatitis_B (n=60) |
|||||||||||||||||||||||||||||||||||||||||||||||||||||||||||||||||||||||||||||||||||||||||||||||||||||||||||||||||||||||||||||||||||||||||||||||||||||||||||||||||||||||||||||||||||||||||||||||||||||||||||||||||||||||||||||||||||||||||||||||||||||||||||||||||||
|---|---|---|---|---|---|---|---|---|---|---|---|---|---|---|---|---|---|---|---|---|---|---|---|---|---|---|---|---|---|---|---|---|---|---|---|---|---|---|---|---|---|---|---|---|---|---|---|---|---|---|---|---|---|---|---|---|---|---|---|---|---|---|---|---|---|---|---|---|---|---|---|---|---|---|---|---|---|---|---|---|---|---|---|---|---|---|---|---|---|---|---|---|---|---|---|---|---|---|---|---|---|---|---|---|---|---|---|---|---|---|---|---|---|---|---|---|---|---|---|---|---|---|---|---|---|---|---|---|---|---|---|---|---|---|---|---|---|---|---|---|---|---|---|---|---|---|---|---|---|---|---|---|---|---|---|---|---|---|---|---|---|---|---|---|---|---|---|---|---|---|---|---|---|---|---|---|---|---|---|---|---|---|---|---|---|---|---|---|---|---|---|---|---|---|---|---|---|---|---|---|---|---|---|---|---|---|---|---|---|---|---|---|---|---|---|---|---|---|---|---|---|---|---|---|---|---|---|---|---|---|---|---|---|---|---|---|---|---|---|---|---|---|---|---|---|---|---|---|---|---|---|---|---|---|---|---|---|---|---|---|---|---|---|---|---|
| JHU00236.B4C19R2 | KRAS|P01116-2 | 1/263 | |||||||||||||||||||||||||||||||||||||||||||||||||||||||||||||||||||||||||||||||||||||||||||||||||||||||||||||||||||||||||||||||||||||||||||||||||||||||||||||||||||||||||||||||||||||||||||||||||||||||||||||||||||||||||||||||||||||||||||||||||||||||||||||||||||||||
| JHU11656.B12C32R6 | KRAS|P01116 | 0/263 | |||||||||||||||||||||||||||||||||||||||||||||||||||||||||||||||||||||||||||||||||||||||||||||||||||||||||||||||||||||||||||||||||||||||||||||||||||||||||||||||||||||||||||||||||||||||||||||||||||||||||||||||||||||||||||||||||||||||||||||||||||||||||||||||||||||||
| JHU13939.B11C29R38 | KRAS|P01116-2 | 11/263 | |||||||||||||||||||||||||||||||||||||||||||||||||||||||||||||||||||||||||||||||||||||||||||||||||||||||||||||||||||||||||||||||||||||||||||||||||||||||||||||||||||||||||||||||||||||||||||||||||||||||||||||||||||||||||||||||||||||||||||||||||||||||||||||||||||||||
| ID | Name | Platform | Group | Comparison | P-value | BH Adjusted | Significant | Log OR | Hits Group |
Hits Comparison |
|---|---|---|---|---|---|---|---|---|---|---|
| JHU13939.B11C29R38 | KRAS|P01116-2 | HuProt_532 | Vietnam_HCC | vs_cohort | 0.071 | 0.575 | No | -1.372 | 2/120 | 9/143 |
| JHU13939.B11C29R38 | KRAS|P01116-2 | HuProt_532 | Vietnam_HCC | vs_control | 0.411 | 0.938 | No | -0.977 | 2/120 | 1/23 |
| JHU13939.B11C29R38 | KRAS|P01116-2 | HuProt_532 | Vietnam_Cirrohosis | vs_cohort | 0.279 | 1.000 | No | 0.690 | 4/60 | 7/203 |
| JHU13939.B11C29R38 | KRAS|P01116-2 | HuProt_532 | Vietnam_Hepatitis_B | vs_cohort | 0.279 | 1.000 | No | 0.690 | 4/60 | 7/203 |
| JHU13939.B11C29R38 | KRAS|P01116-2 | HuProt_532 | Vietnam_Cirrohosis | vs_control | 1.000 | 1.000 | No | 0.447 | 4/60 | 1/23 |
| JHU13939.B11C29R38 | KRAS|P01116-2 | HuProt_532 | Vietnam_Hepatitis_B | vs_control | 1.000 | 1.000 | No | 0.447 | 4/60 | 1/23 |
Human phage display immunoprecipitation-sequencing (PhIP-Seq) detects autoantibodies via a >700,000 49mer peptide library covering the human proteome (HuScan). Raw phage counts enriched in each sample are compared to mock-immunoprecipitation controls (beadsonly) via edgeR. Hits are called when P ≤0.0001 and >4-fold above edgeR-computed background. Displayed are log2 fold-changes for patients passing this threshold for peptides matching this gene; non-hits shown as zero. All data are binarized into hit / no-hit for statistics for case vs cohort and case vs control analysis via Fisher exact test with BH correction. Complete data with peptide sequences available for download below. Learn more about our assay platforms.
A total of 7 peptides included in assay; 0 above visualization threshold.
| ID | Name | Total Hits | Control_Pooled (n=23) |
Vietnam_HCC (n=120) |
Vietnam_Cirrohosis (n=60) |
Vietnam_Hepatitis_B (n=60) |
|||||||||||||||||||||||||||||||||||||||||||||||||||||||||||||||||||||||||||||||||||||||||||||||||||||||||||||||||||||||||||||||||||||||||||||||||||||||||||||||||||||||||||||||||||||||||||||||||||||||||||||||||||||||||||||||||||||||||||||||||||||||||||||||||||
|---|---|---|---|---|---|---|---|---|---|---|---|---|---|---|---|---|---|---|---|---|---|---|---|---|---|---|---|---|---|---|---|---|---|---|---|---|---|---|---|---|---|---|---|---|---|---|---|---|---|---|---|---|---|---|---|---|---|---|---|---|---|---|---|---|---|---|---|---|---|---|---|---|---|---|---|---|---|---|---|---|---|---|---|---|---|---|---|---|---|---|---|---|---|---|---|---|---|---|---|---|---|---|---|---|---|---|---|---|---|---|---|---|---|---|---|---|---|---|---|---|---|---|---|---|---|---|---|---|---|---|---|---|---|---|---|---|---|---|---|---|---|---|---|---|---|---|---|---|---|---|---|---|---|---|---|---|---|---|---|---|---|---|---|---|---|---|---|---|---|---|---|---|---|---|---|---|---|---|---|---|---|---|---|---|---|---|---|---|---|---|---|---|---|---|---|---|---|---|---|---|---|---|---|---|---|---|---|---|---|---|---|---|---|---|---|---|---|---|---|---|---|---|---|---|---|---|---|---|---|---|---|---|---|---|---|---|---|---|---|---|---|---|---|---|---|---|---|---|---|---|---|---|---|---|---|---|---|---|---|---|---|---|---|---|---|
| No targets above threshold for visualization | |||||||||||||||||||||||||||||||||||||||||||||||||||||||||||||||||||||||||||||||||||||||||||||||||||||||||||||||||||||||||||||||||||||||||||||||||||||||||||||||||||||||||||||||||||||||||||||||||||||||||||||||||||||||||||||||||||||||||||||||||||||||||||||||||||||||||
No targets above threshold for statistical analysis
Mutation hotspot data from The Cancer Genome Atlas (TCGA). Created via analyzing 10,437 unique patient tumors across 33 cancer types (Thorsson et al., 2018).
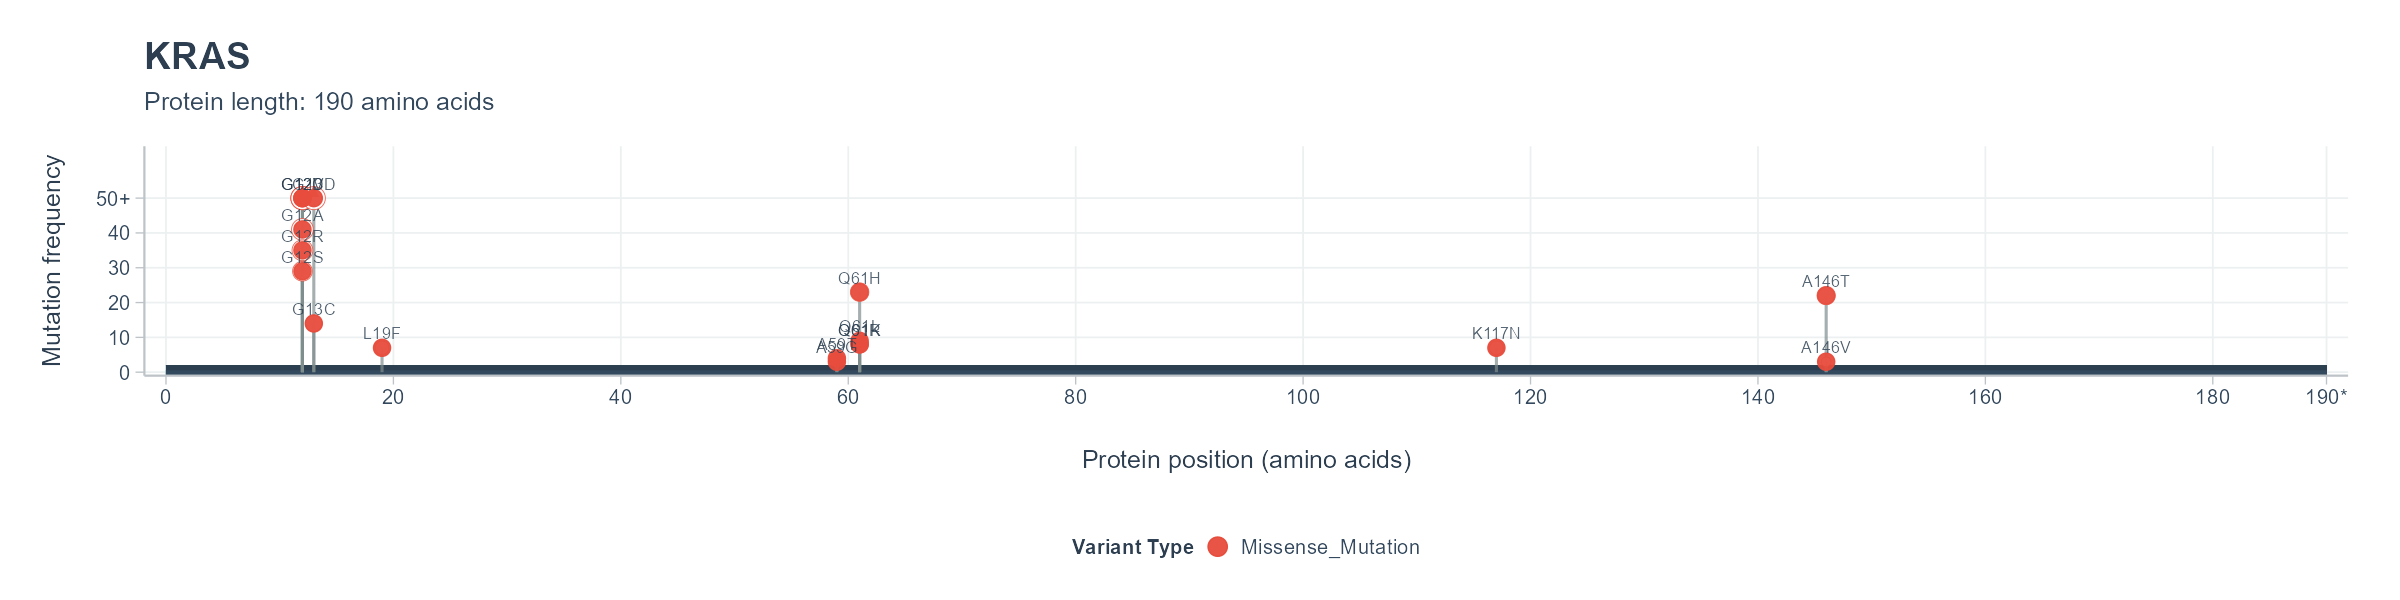
Mutation frequency analysis from The Cancer Genome Atlas (TCGA) showing hotspot neoantigens for KRAS.
Mutation hotspots identified from TCGA data corresponding to the visualization above.
| Gene | Transcript | Variant | Frequency | Cancer Types | Window Start | Window End | Peptide Sequences |
|---|---|---|---|---|---|---|---|
| KRAS | ENST00000256078 |
Missense_Mutation G12D |
1.77% | GBM;PAAD;LUAD;COAD;KIRP;UCEC;LAML;READ;STAD;CESC;BLCA;LIHC;BRCA;SKCM;ESCA;UCS;PRAD;THYM | 1 | 28 |
GGGSGMTEYKLVVVGAGGVGKSALTIQLIQNHF
GGGSGMTEYKLVVVGADGVGKSALTIQLIQNHF
|
| KRAS | ENST00000256078 |
Missense_Mutation G12V |
1.51% | LUAD;OV;TGCT;PAAD;KIRP;LUSC;COAD;UCEC;LAML;READ;BRCA;BLCA;CESC;THCA;STAD;UCS | 1 | 28 |
GGGSGMTEYKLVVVGAGGVGKSALTIQLIQNHF
GGGSGMTEYKLVVVGAVGVGKSALTIQLIQNHF
|
| KRAS | ENST00000256078 |
Missense_Mutation G12C |
0.92% | LUAD;LIHC;COAD;READ;UCEC;BRCA;KIRC;STAD;BLCA;SKCM;CESC;PAAD;UCS;MESO | 1 | 28 |
GGGSGMTEYKLVVVGAGGVGKSALTIQLIQNHF
GGGSGMTEYKLVVVGACGVGKSALTIQLIQNHF
|
| KRAS | ENST00000256078 |
Missense_Mutation G13D |
0.66% | LUAD;BLCA;COAD;UCEC;LAML;READ;STAD;CESC;LIHC;SKCM | 1 | 29 |
GGGSMTEYKLVVVGAGGVGKSALTIQLIQNHFV
GGGSMTEYKLVVVGAGDVGKSALTIQLIQNHFV
|
| KRAS | ENST00000256078 |
Missense_Mutation G12A |
0.36% | TGCT;LUAD;LUSC;COAD;READ;UCEC;PAAD;UCS;LGG | 1 | 28 |
GGGSGMTEYKLVVVGAGGVGKSALTIQLIQNHF
GGGSGMTEYKLVVVGAAGVGKSALTIQLIQNHF
|
Prognostic data from The Cancer Genome Atlas (TCGA). Summaries created by the Human Protein Atlas via analyzing gene expression impact on patient survival across multiple cancer types.